Home > Sea Surface Temperature Charts
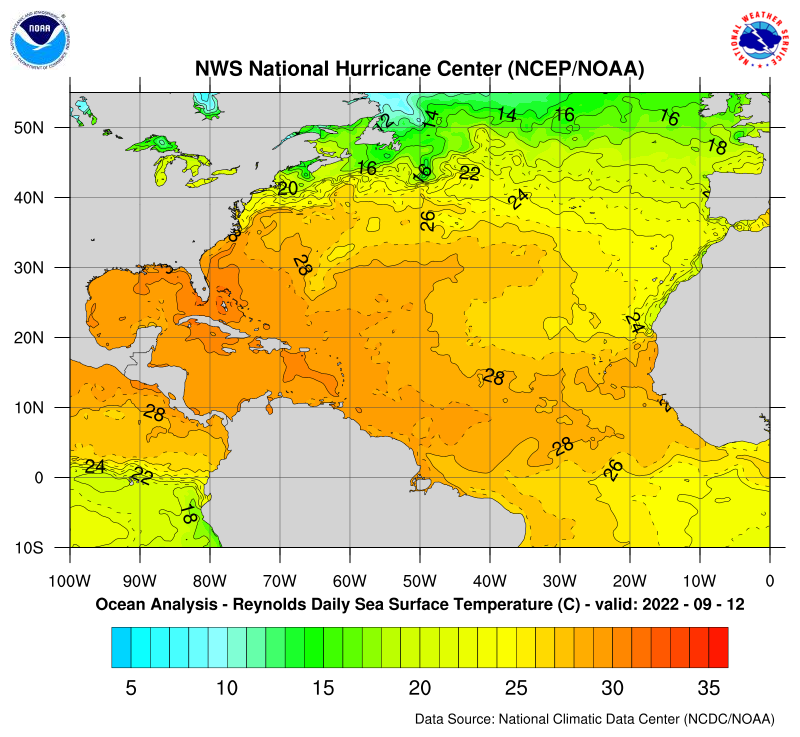
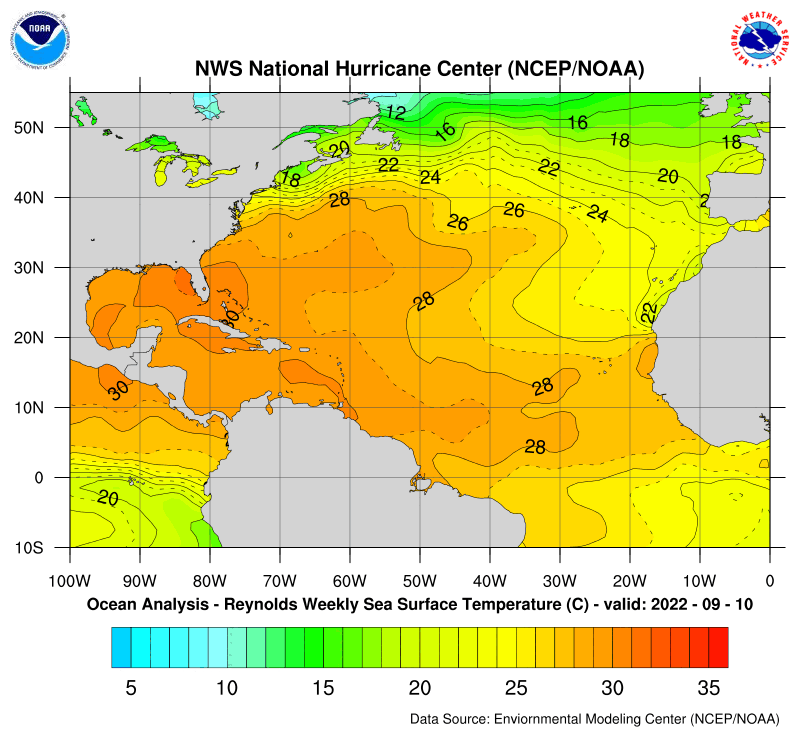
Reynolds Sea Surface Temperature (SST) Charts are created by the NOAA (National Oceanic and Atmospheric Administration) and are widely used by scientists and researchers to track and analyze changes in sea surface temperatures over time. The Reynolds SST Charts provide a global view of sea surface temperatures, and are created using satellite data and in-situ measurements collected from buoys, ships, and other sources. The charts are useful for a wide range of applications, including weather forecasting, climate research, and fisheries management.
Join our official Facebook group for updates and more! Connect with fellow weather enthusiasts today!


